STATSBUDDY
  • Home
  • Statistics
  • Analytics
  • Toolkit
  • Projects
  • Games
  • Datasets
  • Contact Me
  • Collect Data

Blog

Pranked by my own Data Visualization!

4/7/2020

2 Comments

 
Picture
​Have you ever been pranked by the data visualization you created?

Recently I was.

It was April Fool's Day.

It was a bright day outside, but I was not allowed to leave my house. So I was working on my next online lecture on how to tell a story using data visualization. The data I was using was about the houses in a locality. It contained information on the lot size, the total household income, and whether they own lawnmowers.
​
I first tried a scatter plot with lot size and household income. It came out to be something like the below.
Picture
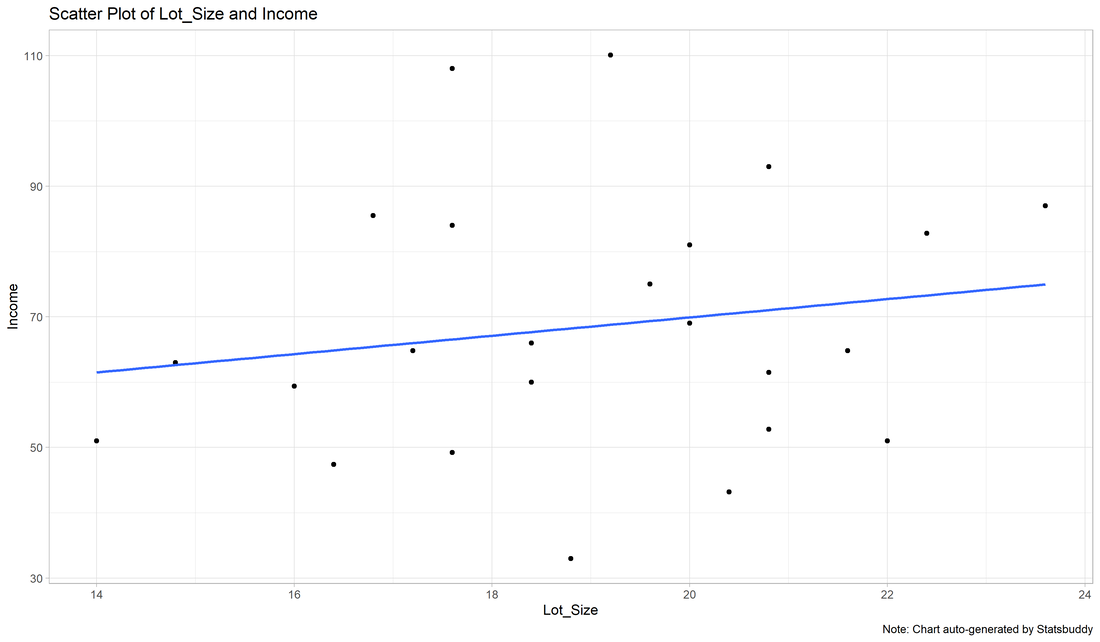
I was happy to see a pattern that I expected. It was, the richer have bigger lots.

So I registered this story point and moved ahead with my trial and error.
​
Until I found the below visualization.
Picture
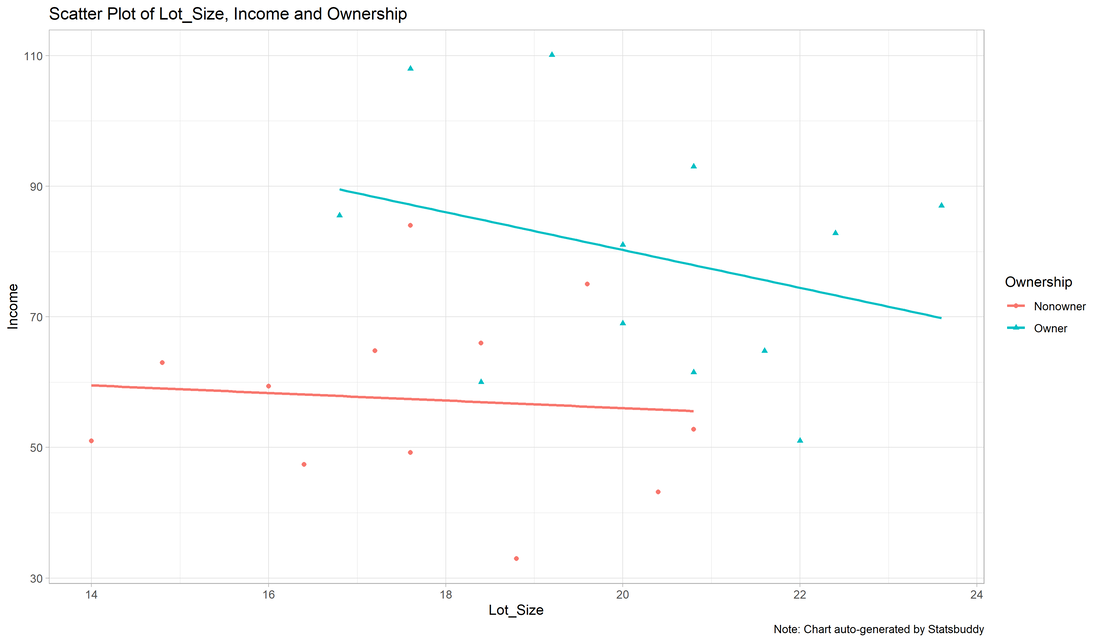
It completely flipped my earlier story upside down! 

Now it was telling me, the richer have smaller lots!

Believe me, it was the same diagram as above, with the lawnmower information in different colors and shapes.

So, listen, if you work with visualizations, be careful. They somehow learned how to prank the creator!

​Maybe they have grown some artificial intelligence!
2 Comments

An Analytics chatbot for non-technical business students

1/12/2020

0 Comments

 
0 Comments

10 ways to screw your data visualization!

1/7/2020

0 Comments

 
0 Comments

Types of Analytics

1/2/2020

0 Comments

 
Picture
Suppose you are a soccer journalist in a newspaper and you missed an important match because you were getting married at that time. How would you write the next day's report?

  • If you watch the highlights to watch only the goals, you are doing Descriptive Analytics.​
  • If you are referring to the full recording of the match from time to time, in addition to watching the highlights, to analyze what were the reasons for those goals, you are doing Diagnostic Analytics.
  • If you watch the full recording of the match with an objective to identify patterns in one team's general strategy, you are doing Predictive Analytics.
  • If you watch the full recording of the match multiple times to figure out what should be the other team's counter-strategy in the next match against the same team, you are doing Prescriptive Analytics.
  • If your newlywed partner doesn't let you watch any of the above, you are doing chores.
0 Comments

    Archives

    April 2020
    January 2020

    Categories

    All
    Beginner
    Intermediate

    RSS Feed

Powered by Create your own unique website with customizable templates.
  • Home
  • Statistics
  • Analytics
  • Toolkit
  • Projects
  • Games
  • Datasets
  • Contact Me
  • Collect Data